Personal Metrics
This is just a quick post following on from some recent conversations in this area. tldr: Tracking some data about yourself is a great exercise, and I highly recommend it. In this post I’ll share a few of the tools I use, and dig around in my own data to see if there are any interesting insights….
Time Tracker: Toggl
The first source of data is my time tracker: toggl. It’s simple to use, and has a web app as well as a good android app. As a consultant, this is useful for billing etc, but it has also just become a general habit to log what I’m working on. It’s good motivation not to context-switch, and it’s a great way to keep track of what I’m up to. A good day of work can sometimes mean 4 hours on the clock, since I tend not to log small tasks or admin, but it’s still good enough that I’ll bill clients based on the hours logged. Toggle let you do some reporting within the app, but you can also export the data to CSV for later analysis. Here’s my last two years, total seconds per month:
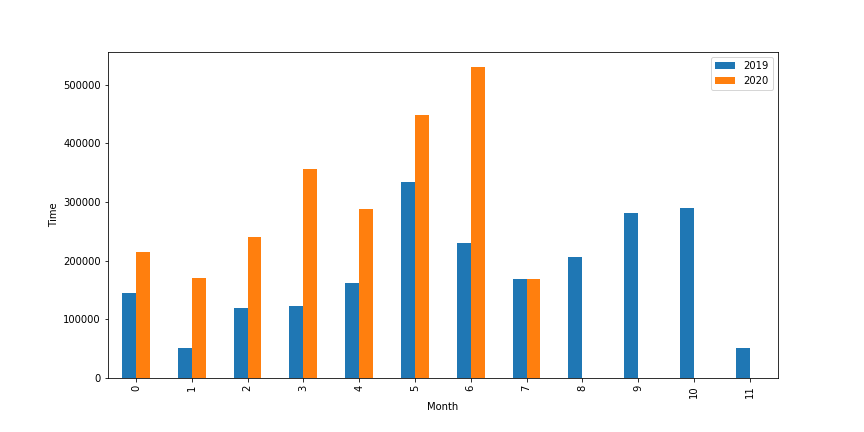
Time logged per month (as of August 12)
As you can see, I’ve been busier than normal the past few months - one of the reasons this blog hasn’t had any new posts for a while!
Daily mood and activities: daylio
Daylio is a smartphone app that asks ‘How was your day?’ every day, and optionally let’s you log activities for the day. I’ve made it a habit, although tracking stopped for a few months at the start of the pandemic :/ One thing I like about this (and the previous thing I used, https://year-in-pixels.glitch.me/) is that it forces you to evaluate how you’re feeling. Was today great, or merely good? Why was it ‘Meh’? And by quantifying something less concrete than simply hours worked, it let’s me see what I can do to optimize for generally better days.
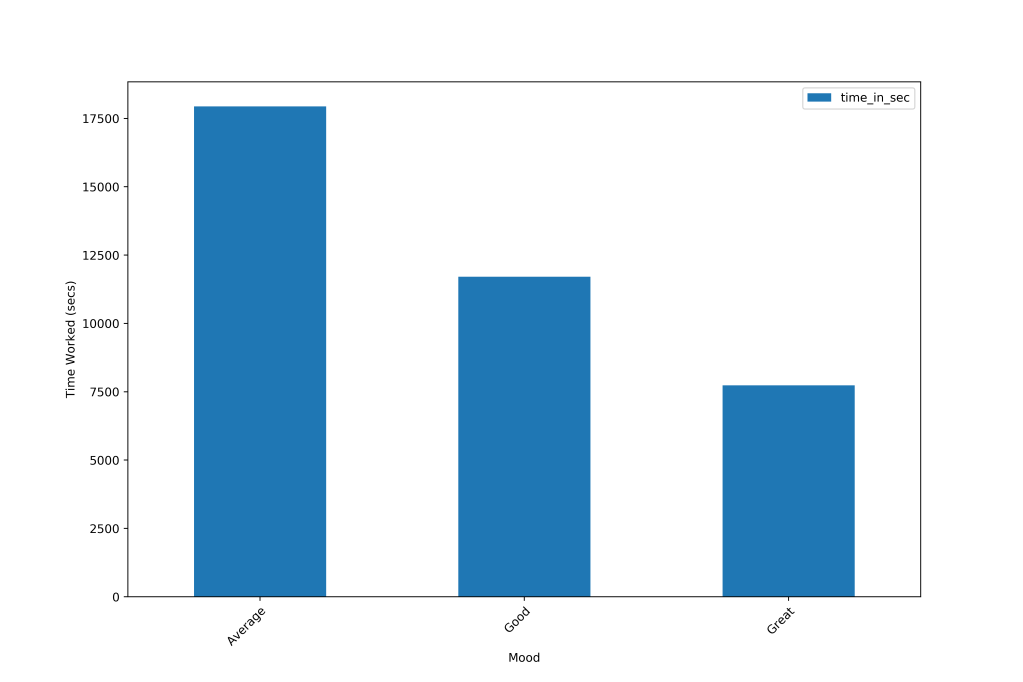
Time worked on days marked as Average, Good or Great
Mondays are my lowest day, followed by Wednesdays. Being outdoors bumps my rating from ~4 (good) to nearly 4.5 (5 being ‘great’). As you can see in the image above, lots of work tends to mean not-so-great days. Around 3 hours per day logged (4-6 hours work) is where I start properly having fun, and if I can fit in activities like birding or something creative then it’s even closer to optimum. I’m in a pretty good place now despite the busyness - the average score (~4.3) is much higher than when I was still in uni trying to balance work and assignments (3.3). It’s nice to see this - on tougher days it’s amazing to look back and see how many good or great ones there are, and how lovely life is overall.
Moar data: uLogMe
I recently found a project called uLogMe (by Karpathy oif all people), and after reading his post about it I decided to give it a go. If you’re keen to try it, look for a fork on HitHub as the original project is deprecated. I only use the logging scripts, which keep track of active window title and number of keystrokes in each 9s window. This is really fun data, as you can identify different activities, find patterns, see trends in when you’re most active… As one example, look at a fairly typical day from last month:
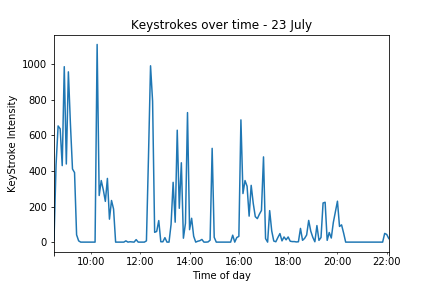
Keystroke intensity over time
You can see me start a little late, since it’s winter. After an initial burst of work I went on a long walk looking for insects (there was a bioblitz on) before hacking away during my 10am meeting. There are spikes of activity and periods of very little (meetings) or no (breaks) activity. 6-8pm is my class time, so I’m tapping away in demos as I teach, especially in the second half of the lesson.
Check out Karpathy’s post to see what else it’s possible to do with this data.
Putting it all together
I can’t wait to get a fitness tracker to add sleep tracking, exercise and heart rate. But even without those, I have some really great data to be playing with. I can see relationships between external factors (travel, activities, work) and my mood, explore how much time goes into different projects, graph the number of characters being typed in different applications (spoiler: I use Jupyter a LOT) and generally put some hard numbers behind my intuition around how I’m spending my time and how that’s affecting me.
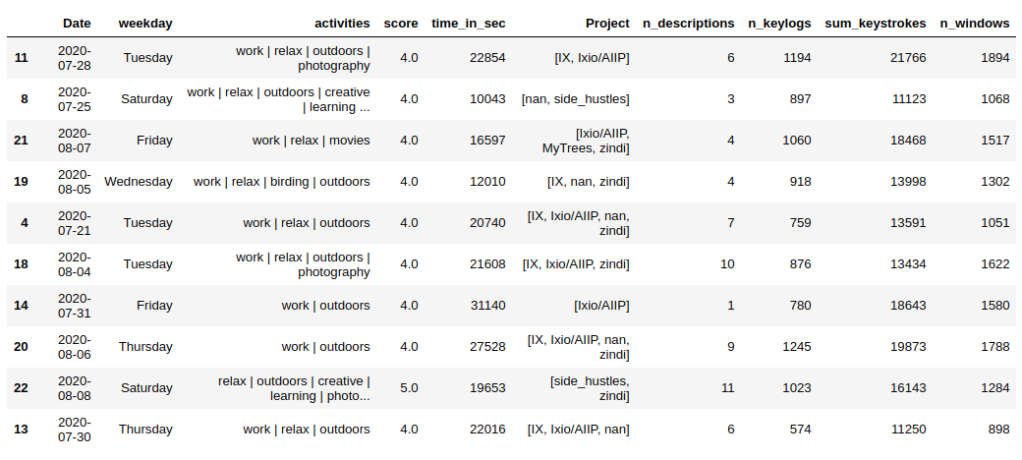
A small subset of the data now waiting to be analysed
I hope that this post marks a return to this blog for me (hours are trending downwards now that some courses I teach are wrapping up) and that it inspires you to find some personal data to track! If you still aren’t convinced, here’s a TED talk that might push you over the edge. Happy hacking :)